
Eight screens, in the order your office meets them
This is the dashboard as it actually ships, captured from the live demo practice. Every figure on these screens is sample data. In your own dashboard each one comes out of the practice software your office already runs, and belongs to you.
The overview
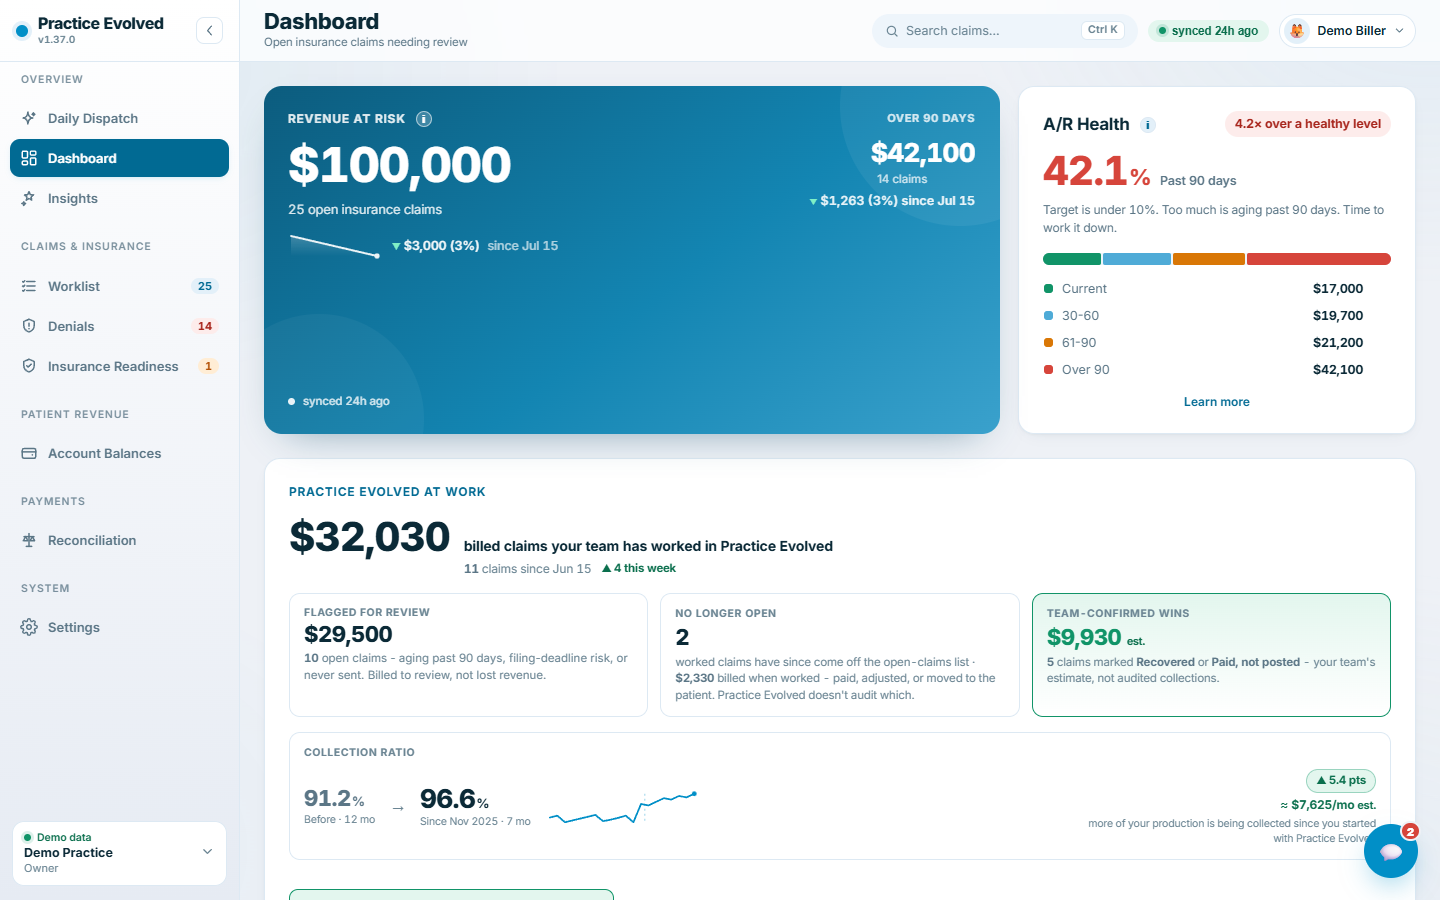
The one screen an owner opens first: how much is billed and still sitting open, how badly it is aging, and what the team has already worked.
What to look at
- The headline figure is what was billed to insurance and has not come back resolved. It is a signal to review, never confirmed money.
- The aging split underneath is the same total cut by age, so you can see at a glance whether the problem is new or old.
- The work card is your own team's activity, not ours: claims touched, claims flagged, claims no longer open.
What to do next
If the over 90 bucket is the largest one, open the worklist and start at the top.
Every open claim, oldest first
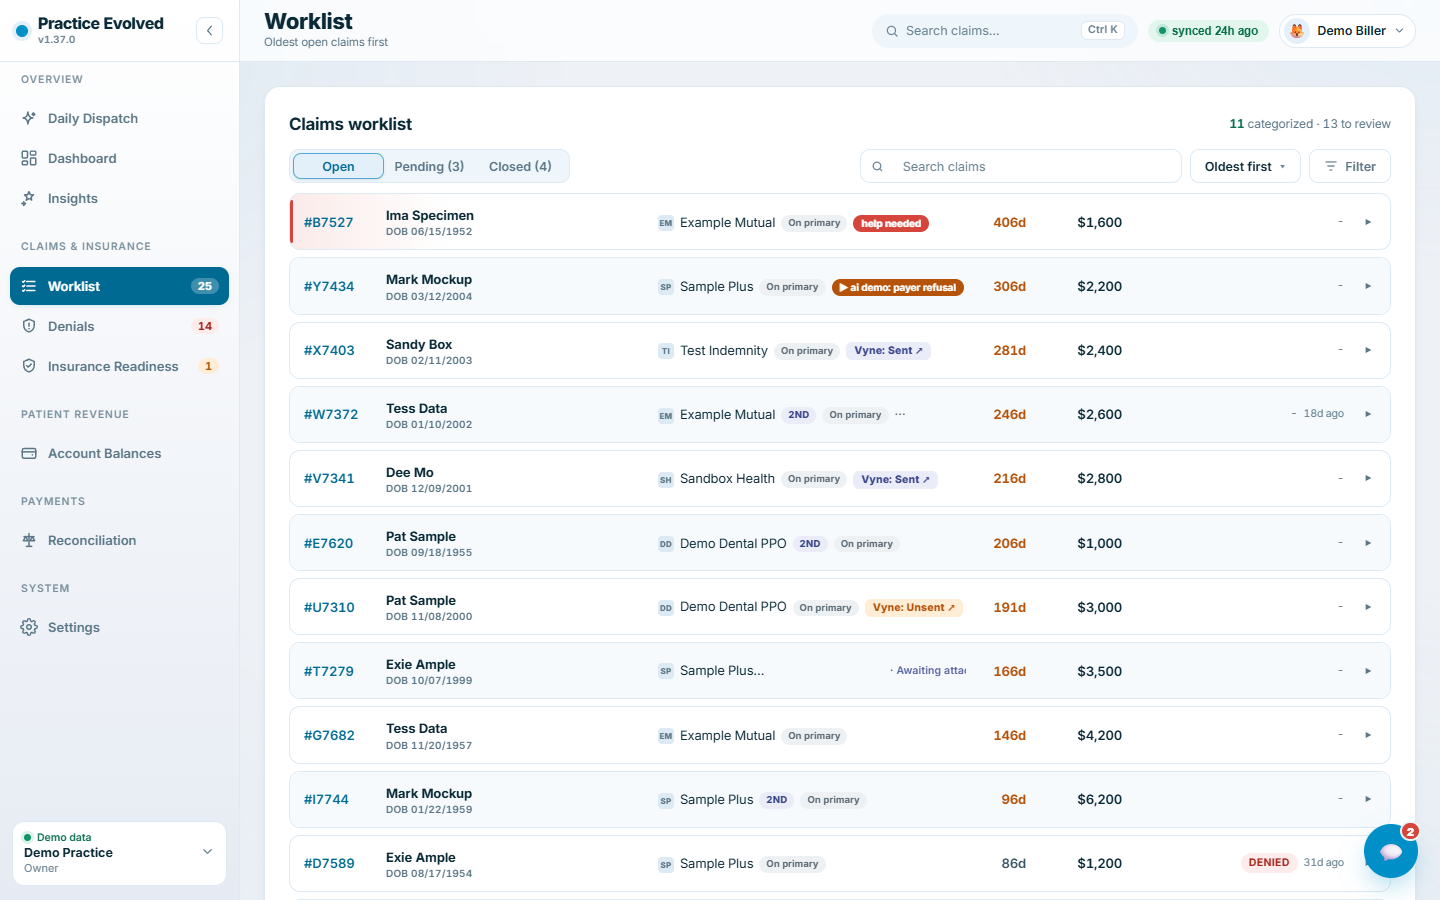
One queue for every claim that has left the office and not come back resolved, ordered so the oldest and most at risk money is the first thing anybody sees.
What to look at
- Days open runs from the original date of service, so resending a claim does not reset it to zero.
- The clearinghouse status tells you whether the claim ever left the building, which is a different question from whether the payer answered.
- Labels and assignment are shared, so two people cannot quietly work the same claim twice.
What to do next
Open the oldest row. Everything needed to make the call is on the card.
Working one claim
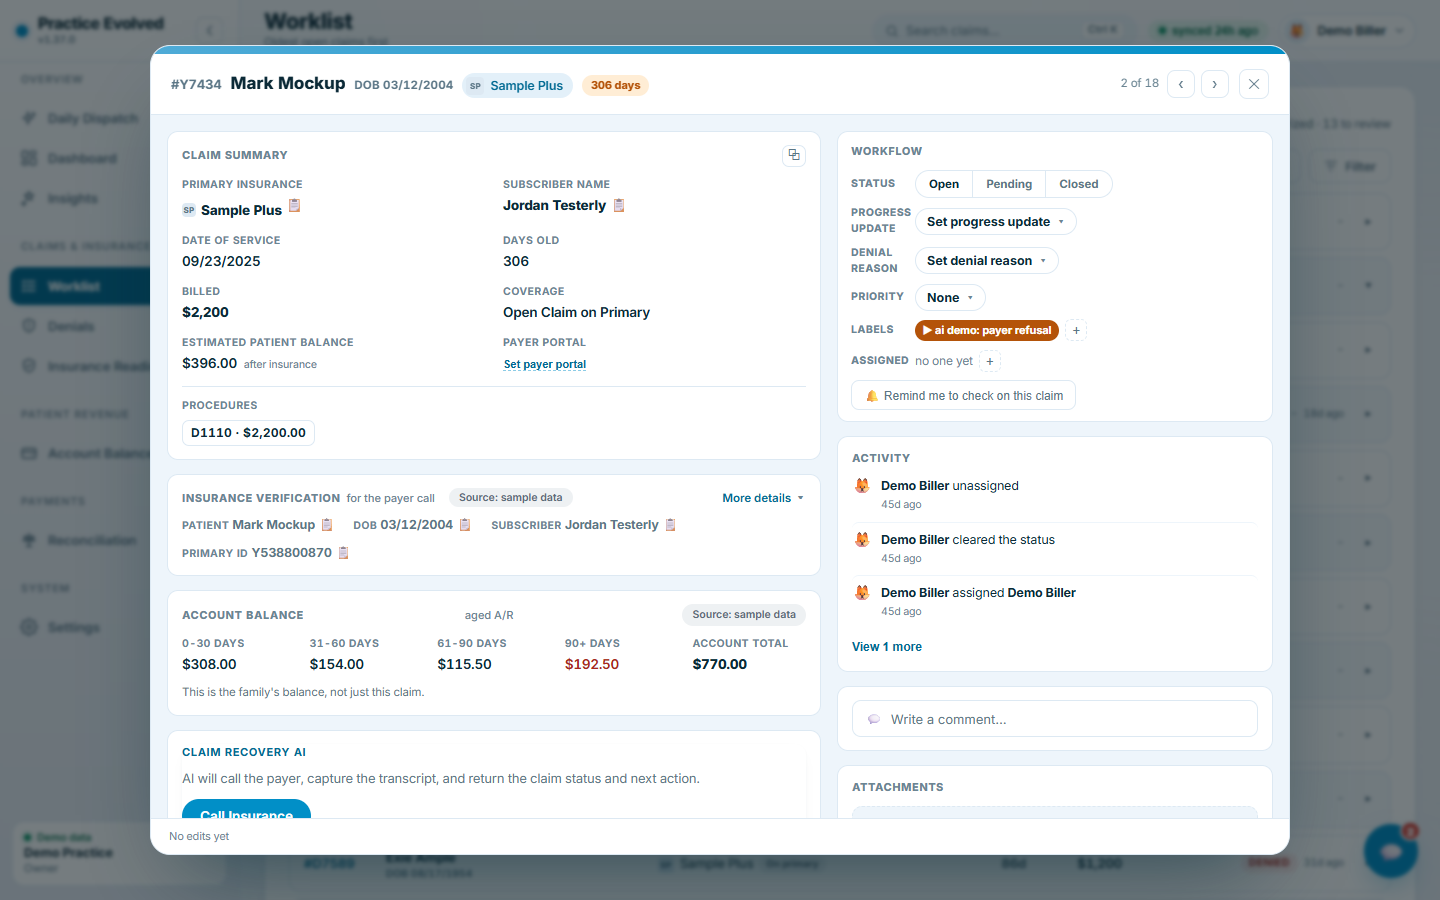
The claim card carries the facts a payer will ask for, the family balance behind the claim, and the shared status the rest of the team sees.
What to look at
- The verification block is there so nobody has to open the practice software mid call to answer who the subscriber is.
- Status and progress are two different fields, because where a claim is in its life is not the same as what is currently being done about it.
- The activity feed is the audit trail: who called, when, and what the payer said.
What to do next
Record the outcome on the card. The worklist, the aging and the team view all move with it.
Claims that never reached the payer
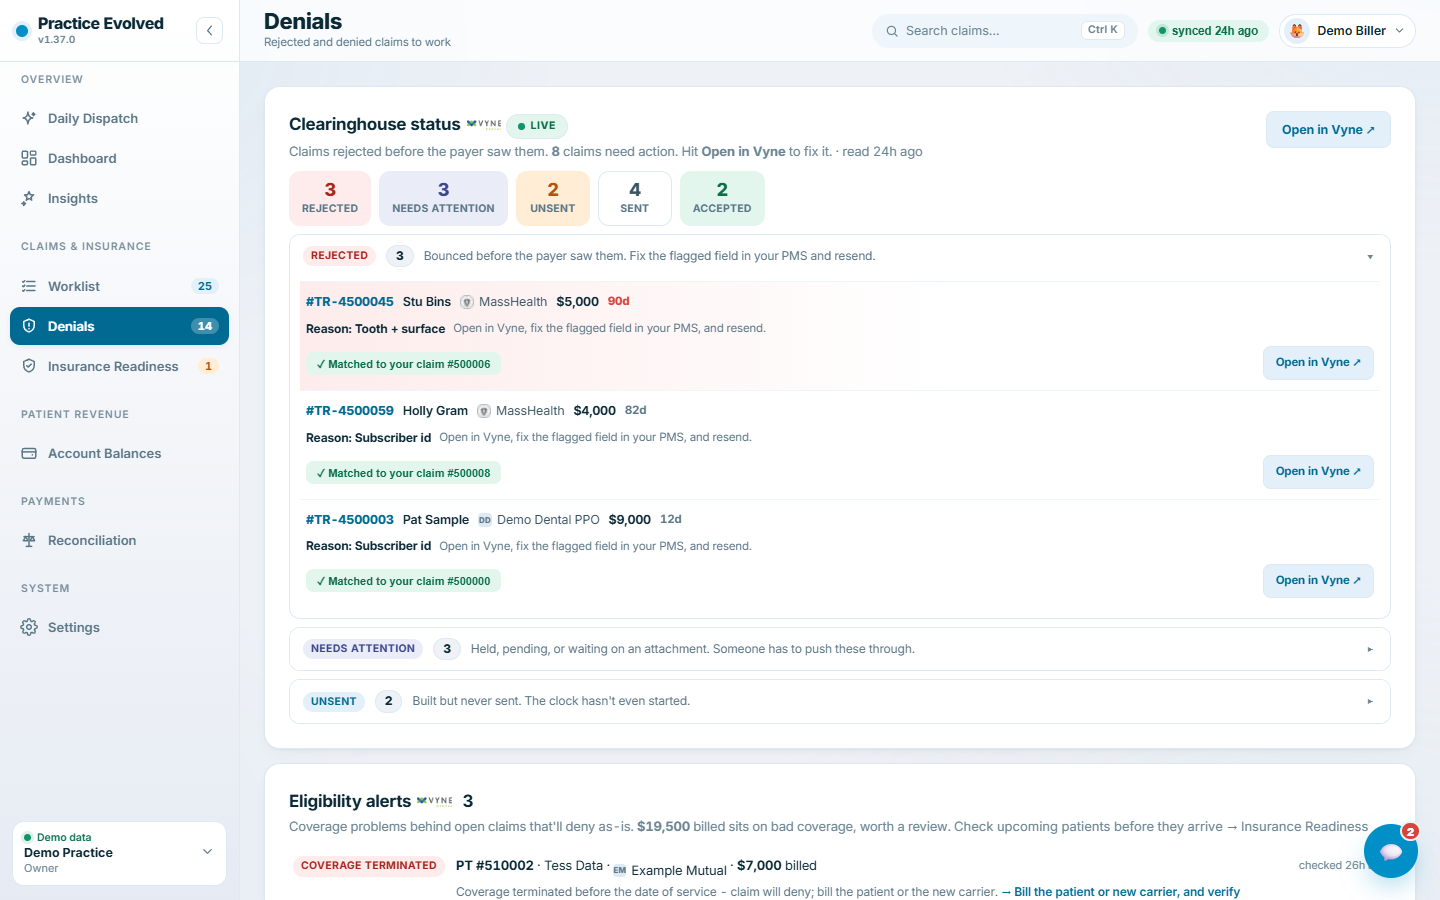
The denials view separates claims a payer refused from claims that were rejected before anybody looked at them, and names the field to fix.
What to look at
- Rejected is not denied. A rejected claim never reached adjudication, so there is nothing to appeal and everything to correct.
- Unsent is the quietest failure in dental billing: the claim is in your system and has never left it.
- The eligibility alerts are claims sitting on coverage that has already lapsed.
What to do next
Fix the named field and resend. Nothing here needs an appeal letter.
How badly the A/R is aging
The same open money, cut by age, with each band shown against the goal the board holds it to.
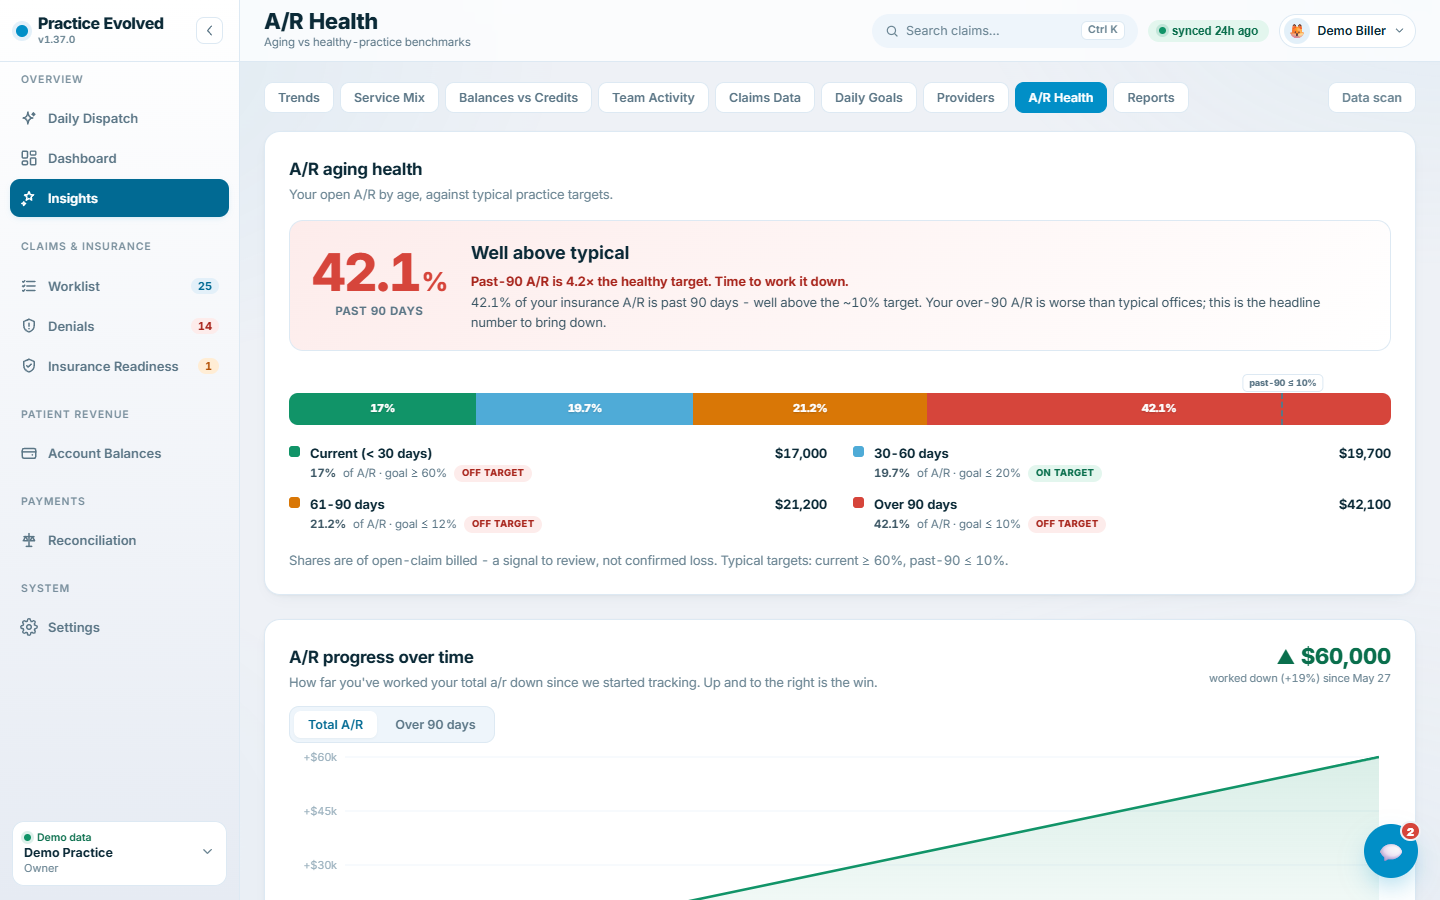
What to look at
- Each band carries its own target, so the page tells you which bucket is actually out of line rather than just showing four numbers.
- The shares are of billed dollars on open claims, which is a review signal and not a loss.
- The progress chart runs from the day tracking started, so it shows direction rather than a single morning's total.
What to do next
Pick the band that is off target and filter the worklist to it.
What patients owe
Account balances rolled up to the person responsible for them, with the family behind each one and the note history the whole team can see.
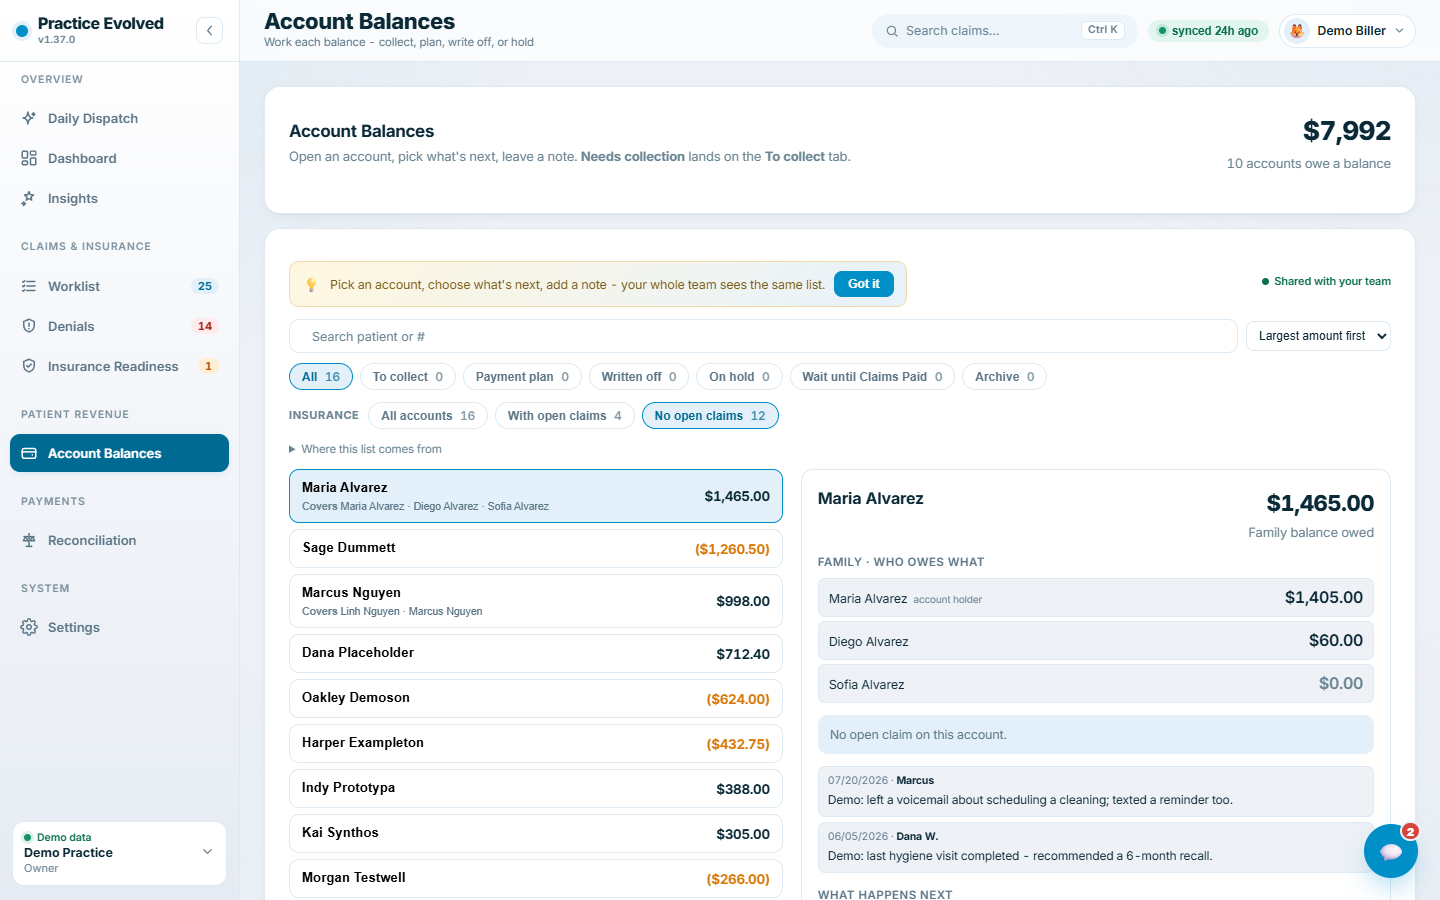
What to look at
- Balances roll up to the responsible party, so a family is one row and one conversation rather than three.
- Credit balances show in parentheses, because an account that is owed money is not an account to call about a payment.
- The insurance filter separates balances waiting on a payer from balances that are genuinely the patient's now.
What to do next
Work the no open claims filter first. Those are the balances nothing is pending on.
Whether the money landed
Collections measured against production every day, with credits netted out so the receivable is the real one.
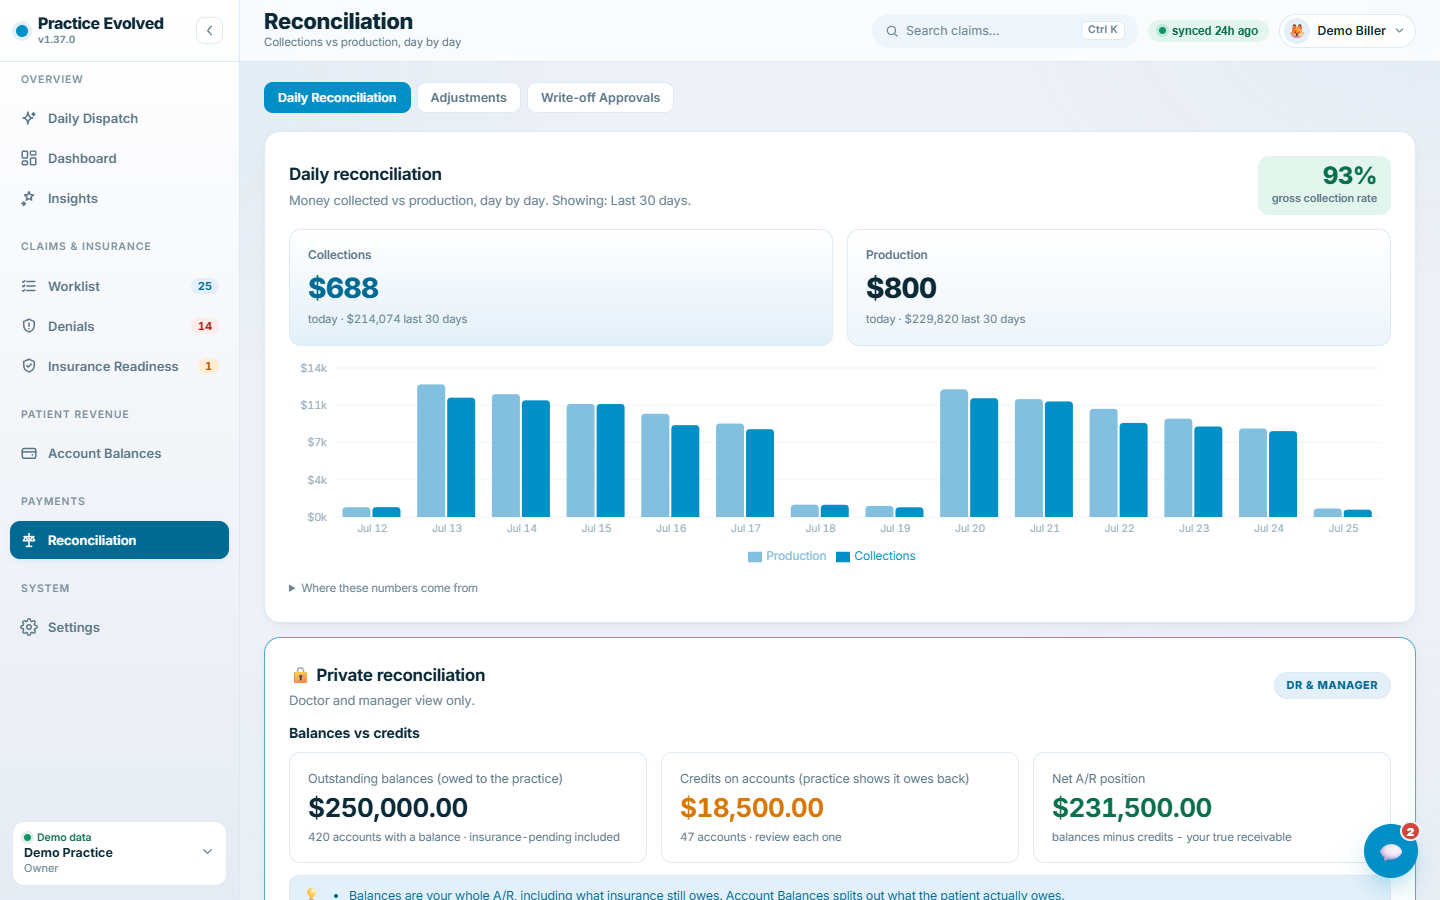
What to look at
- A daily pairing catches a posting gap the same week rather than at month end.
- The credit total is netted out, because credits sitting on accounts make a receivable look bigger than it is.
- The private panel is scoped to a doctor or a manager, not to everybody with a login.
What to do next
Any day where the two bars diverge sharply is worth one question at the morning huddle.
Direction, not just today
Every key measure saved at each sync, so an owner can see whether the numbers are moving and in which direction.
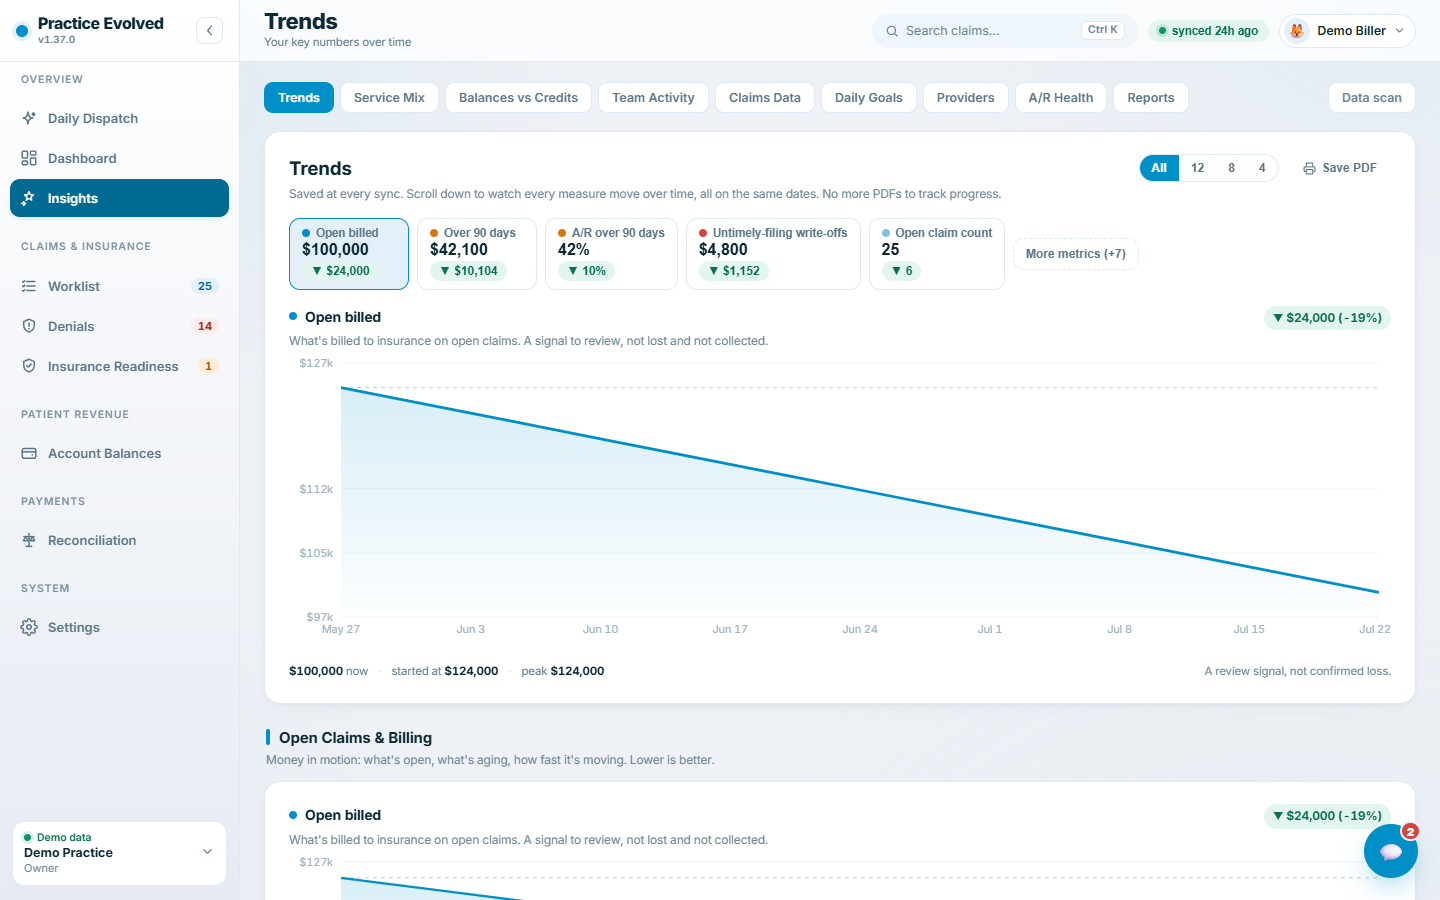
What to look at
- Every point on these charts is a real sync, not a monthly snapshot typed in afterwards.
- Down is the win on open billed and on the over 90 share, which is why both charts read as a decline.
- Open claim count sits beside the dollar figures because a count cannot be distorted by an estimate or an adjustment.
What to do next
Watch the open claim count. It moves for exactly one reason, which is whether the claims are being worked.
Where the numbers come from
Practice Evolved reads your practice software, and there is exactly one thing it can write back. What that means in practice, how to check a vendor’s claim rather than take it, and where the business associate agreement fits are all covered in giving a vendor access to your practice database. The reports these screens are built from are explained one by one in the guides library, and what the connection does and does not carry is set out on the security page.